In this Topic Hide
Newer versions of SWI can be configured to use and process requests from a SEQUEL Web Server (SWS).
Using a single program, a Java server, an HTTP server and SEQUEL software are installed and configured on a PC within your network. The SWS provides improved performance, multi-system access in the Explorer, multi-system object support in Dashboards, and interactive client tables.
Once a Client Table is displayed, users can perform as much interactive analysis as they need locally including data filtering, drill-down, data pivoting, print/preview, and graphing.

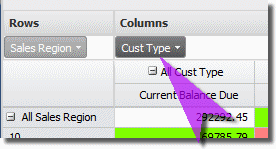
The Client Table is very similar to its ViewPoint counterpart. In the example above, you can see how Row fields create groups on the left-side of the display, Column fields spread the data across the screen, and Data Fields show the aggregate value (sum, max, min, and so on).
Available fields from the view are displayed above the table and can be dragged to the column or row sections to change the level of grouping. See the sections that follow to learn more about these features.
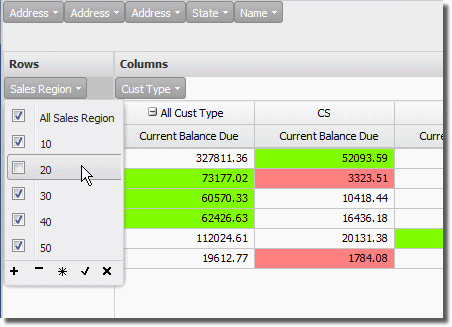
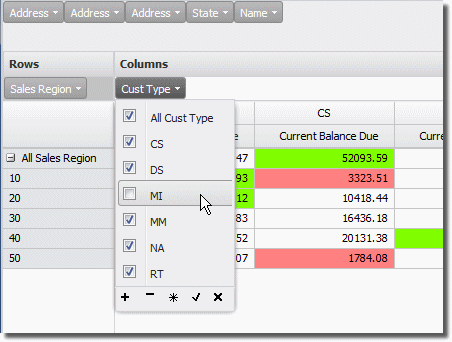
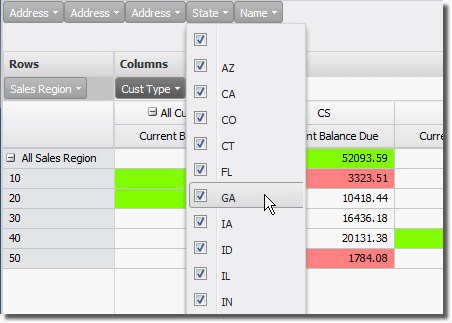
Filtering is easily applied to the Row and Column groups as well as the View fields in the table results display. Simply click the down arrow for any field, and select or de-select the desired values. The table will instantly change to show the new filtered results.
At the bottom of each drop-down filter list is a row of functions.

Select the appropriate function to:
|
|
|
|
|
|
Any field that has a filter applied is highlighted in the display as in this example:

Filter any of the Row fields to control the table groups. Click the arrow next to the field name to access the list of values.

Filter any of the current Column fields to control the number of columns across the display.

Even View fields that are not in the Row or Column sections, can be used to filter the data that is displayed in the table.

One of the most powerful features of the Client Table is the ability to 'pivot' the displayed data. By moving the Row and Column fields, or swapping Row with Column fields, and vice versa, the data can be analyzed and displayed in a multitude of ways.
This, in conjunction with the ability to add and remove Row and Column fields, allows the table to be completely and instantly reconfigured - from high-level summary down to the most detail data point.
Simply click and drag any field from the View, Row, or Column sections, and drop anywhere. A green insertion bar will indicate where the field will be placed. Some examples follow:
In the example below, the State field is moved to the Column section next to the Cust Type field. Notice the green insertion point.

When the field is dropped in place, the data is instantly rearranged and we see states within customer type.

Here the State is moved back to the Row section next to the Sales Region field. Again, the green insertion bar indicates the placement of the field.

Now we see again states within sales region.

Another useful way to change and analyze the table data is by adding or removing fields in the display.
To add a field, click and drag a View field (in the Available Fields section) to place it in either the Row or Column section. A green insertion bar will indicate where the field will be placed.
To remove, click and drag a Row or Column field to drop it onto the Available Fields section.
Most table results are displayed as summary data—many detail records added up and grouped together based on Row and Column fields. The underlying records that support the summary values can easily be displayed ('drilled into') in a separate result window.
Simply choose the summary value at the intersection of a given Row and Column and double click, or right-click and select Show Detail on the menu. A separate view result window will display the underlying detail data.
In the example below, the detail for all customers outstanding balance due in region 10 of California with customer type DS, is displayed by double clicking on the summary value at the intersection of the column and row—in this case $3,883.67. A second window opens to show the five detail records that support this summary amount.

By default all client tables are displayed fully collapsed based on their column and row definition. The different levels for both rows and columns can easily be expanded or collapsed to show more or less data using the plus control displayed to the left of the row or column field,

or by right-clicking grey area just above the row fields, or to the right of the column fields to access a menu of options like so:

Here we chose to expand all rows.
